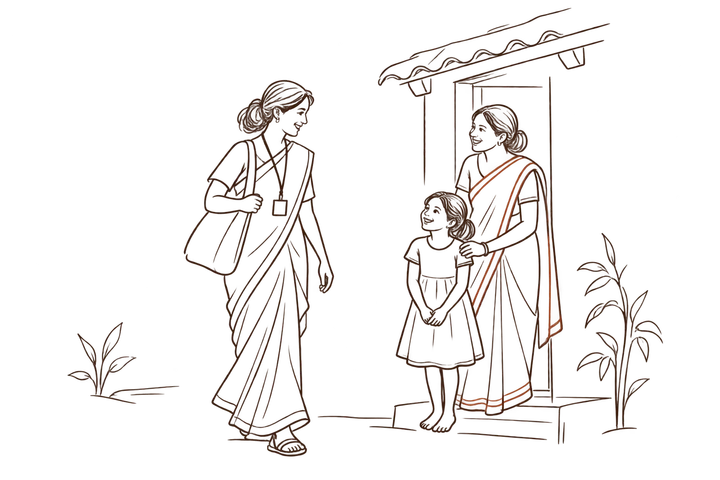
Reach further.
Make vaccination more practical where storage and transport limit access.
Easier delivery could bring vaccination closer to people who miss it today. We are developing patches with that goal—and studying what it would cost to reach them.
Worldwide · 2025
Three doses are needed to complete the routine course.
Global estimates for 2025. DTP protects against diphtheria, tetanus and pertussis.WHO / UNICEF
Make vaccination more practical where storage and transport limit access.
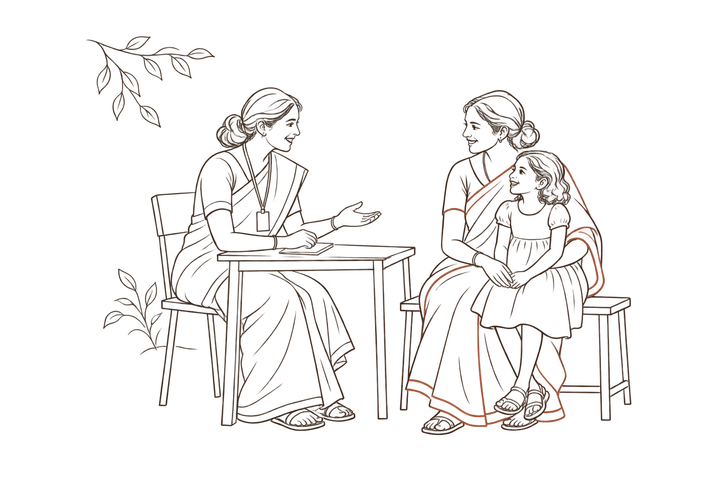
A single-dose patch could make small outreach sessions easier to run.
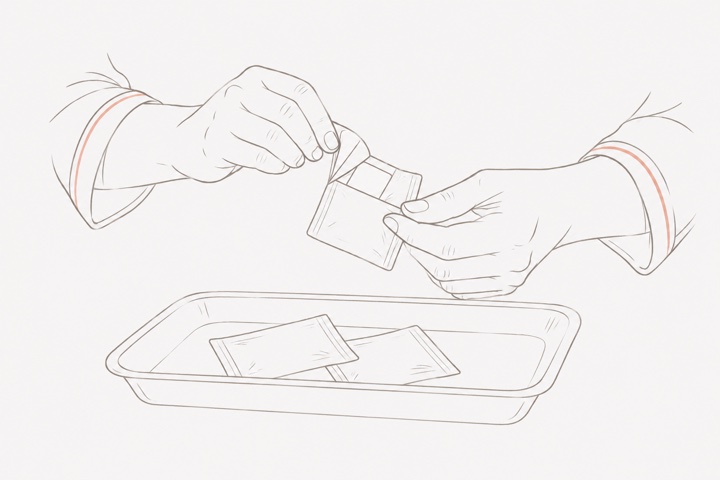
Test whether simpler preparation and application leave more time for care.
Change coverage to explore additional reach. This is an assumption, not a forecast.
MR vaccine: $0.82/dose · Assumed patch: $1.75.
Additional people vaccinated
Same number of people vaccinated
Compare the cost of the same vaccination with each presentation.
Annual vaccine + delivery cost
Includes the cost of switching existing doses and vaccinating additional people.
Coverage and cost changes are assumptions. The starting patch price is $1.75, including a $0.93 premium. All costs use 2024 US dollars.
One selected vaccination. This scenario counts people receiving one selected dose each year, not people completing a full vaccination schedule or becoming protected. Measles–rubella (MR) is the price reference. Other vaccines and populations need their own inputs.
Current approach: people currently vaccinated × ($0.82 vaccine price + current delivery cost). With patches: people vaccinated with patches × ($0.82 + product-price premium + reduced delivery cost), plus any extra outreach cost for additional people.
Reach further applies patches to both the existing vaccinations and the additional vaccinations. Added cost per additional person is the total cost difference divided by additional people vaccinated. When there is no additional reach, this ratio is not defined. Same coverage keeps the number of people vaccinated unchanged.
The starting $1.75 patch price, 30% delivery-cost reduction and 80% → 85% coverage are illustrative assumptions, not an Alterspan quotation, measured performance or a prediction. By default, delivery has the same unit cost for existing and newly reached people; the extra outreach input lets you increase the latter.
This is a selected-vaccination cost comparison, not a full programme budget or a disease-impact model. It excludes wastage, differences in injection supplies and procurement fees, transition costs and avoided illness. Economic savings may represent staff capacity rather than money released from a budget.
Vaccine and delivery inputs: UNICEF, 2024.
A reference childhood schedule, before changing how any vaccine is delivered.
UNICEF’s reference for countries procuring through UNICEF at Gavi-eligible prices. This is a fundraising benchmark; local programme costs vary.
Source: UNICEF, 2024.
The figure uses the report’s combined commodity subtotal, $31.12, plus delivery, $42.03. Its separately displayed vaccine and injection-supply values ($30.29 and $0.76) sum to $31.05. We retain the published combined subtotal without inventing an explanation for that difference.
The report’s $42.03 delivery subtotal also differs from 18 × the rounded $2.34 unit cost ($42.12). The scenario calculator uses the unit cost entered above; the reference figure reproduces the published schedule total.
The people and systems behind each vaccination.
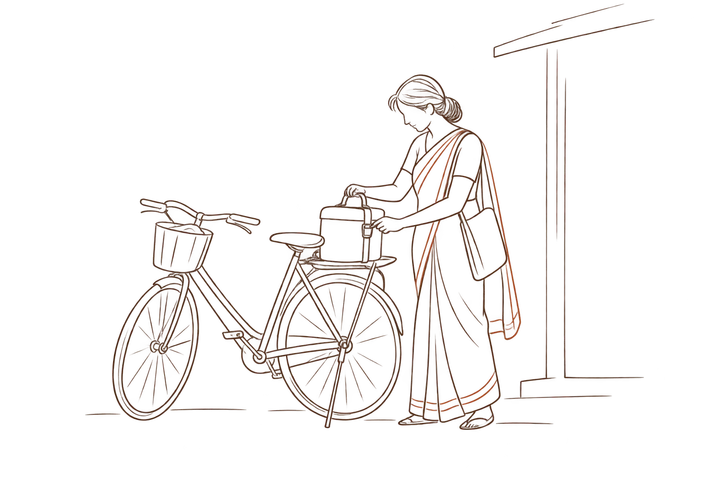
Health workers and training.
Travel, transport and storage.
Waste collection and disposal.

Planning and local facilities.
Community engagement.
Disease and safety monitoring.
Effects depend on stability, application requirements and the delivery setting. A new presentation can also introduce costs.
Changing the presentation does not remove the need to run, monitor and support the programme.
Eleven cost categories from UNICEF, 2024. The grouping is Alterspan’s research hypothesis, not a measured cost reduction.
Selected planning assumptions from UNICEF’s reference schedule. Vaccine, vial size and delivery setting all matter.
Planning assumptions: UNICEF, 2024.